
DISCIPLINE ALIGNED THINKING
Most scientific approach uses the concepts and process in Mathematics such as modelling, statistics and calculations. The application of the scientific approach in the learning process involve skills such as observing, classifying, measuring, predicting, explaining and making conclusions. The scientific approach may also include inquiry. However, both Mathematics and Science concepts and principles are also applied in other subject fields or disciplines.
In any real-world problem or situation, we can establish some results using Mathematical proof, Mathematical modelling, Statistical Inquiry, Scientific Method and Scientific Inquiry.
Those are the different ways of thinking in Mathematics and Science which is elaborated below. Towards the end will compare and contrast Mathematical proof, Mathematical Modelling and Scientific Inquiry.
MATHEMATICAL PROOF
MATHEMATICAL THINKING SKILL
Mathematical proof is a Thinking skill which can be used to approve/verify or disaprove a given hypothesis or statement/equation.
Example:
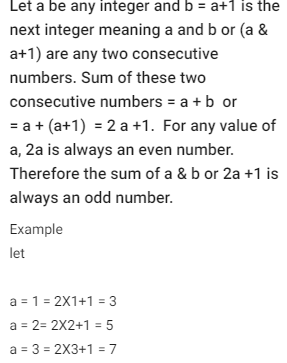
Mathematically prove the statement below:
If a and b are consecutive integers, then the sum of a and b is odd.
MATHEMATICAL MODELLING
MATHEMATICAL THINKING SKILL
Mathematical modelling is also a Thinking skill that can be used to justify a hypothesis or solve a real-world problem. In Mathematical modelling, we take a real-world problem and write it as an equivalent mathematical problem. We then solve the mathematical problem and interpret its solution in terms of the real-world problem. After this, we see to what extent the solution is valid in the context of the real-world problem. We can define Mathematical Modelling as:
First : Define the problem, Make assumptions, Define variables.
Secondly : Get a Solution
Thirdly : Analysis or Explain the results Fourth : Validate and report the results or Step 1: Formulation
i. Stating the question ii. Identifying the relevant factors iii. Mathematical Description Step 2: Finding the Solution
Step 3: Interpretation of the solution in the context of the real-world problem Step 4: Checking/Validating to what extent the model is a good representation of the problem being studied.
STATISTICAL INQUIRY
MATHEMATICAL THINKING SKILL
Statistical inquiry approach is closely related to mathematical modelling which involves inquiring or investigating some phenomena or problem/situation and applying some sort of statistical analysis or model to aid in describing and understanding the particular problem or situation.
An old example of Statistical Inquiry is Tossing a Coin in which you have a 50% of getting either a head or tail if coin is tossed once. However, practically speaking this might be a problem if the coin is tossed more than once.


SCIENTIFIC METHOD
SCIENTIFIC THINKING SKILL
Anne Marie. H (2020) define scientific method as a systematic way of learning about the world around us and answering questions or finding answers/solutions to problems.
It involves identifying the problem and research information, form a hypothesis, design and experiment to get the desired results and finally make a conclusion.

SCIENTIFIC INQUIRY
Science inquiry or scientific inquiry is similar to scientific method but this approach is more active and constructivist
It involves attempting to obtain new knowledge based on explanations which can be tested to make predictions about some phenomenon of interest.
The steps involved in scientific inquiry is similar to the six steps used in scientific method.
-
Define a problem or ask a question
-
Form a hypothesis
-
Plan and conduct an experiment
-
Gather and analyse the results
-
Form a conclusion
-
Explain your experiment/results to others

SCIENTIFIC THINKING SKILL

COMPARE & CONTRAST SCIENTIFIC INQUIRY, MATHEMATICAL PROOF AND MATHEMATICAL MODELLING
Compare mathematical proof, mathematical modelling and science inquiry as they are applied to establishing results about the real world
In scientific inquiry, a hypothesis is formulated which has to be verified or disprove by the experiment design unlike Mathematical proof which is used to proof laws, statements or equations.
In scientific inquiry a theory or hypothesis is proposed which will be supported or verified by the results from the experiment designed to confirm if the theory is true or not. However, in Mathematics when a theory or a statement is proposed, we need to prove if it is true using Mathematical proof. Even the results from the designed experiment can be modelled to verify the theory or hypothesis.
With Mathematical Proof, Mathematical Modelling and Scientific inquiry, we will explain the three-thinking skills process involved in the bridge design using the following steps shown below which is not linear.
Scroll Down
Step 1: Pose a question or a problem
The problem is to identify the effects when load is added on the bridge design. However, to identify and explain the effects or outcome, we will apply different strategies or approaches such as observing, recording, Mathematical proof, Mathematical modelling and other relevant strategies to explain the outcome based on the given questions or problem.

Scientific inquiry
What happens if more load is added on the bridge?

Mathematical Proof
What Mathematical proof can be identified or developed from the bridge design once load is added?

Mathematical Modelling
What Mathematical Modelling can be identified or developed from the bridge design once load is added?

Step 2: Do research and gather information/data to fully understand the problem
Weight is a force that depends on the mass of an object and gravitational acceleration (g = 10m/s2) which is a constant. Weight force is defined as W = mg. g is the acceleration due to gravity and since g is constant, weight force is proportional to mass. As mass increases, weight force also increases. As more load(mass) is added on the bridge, the weight force increases.
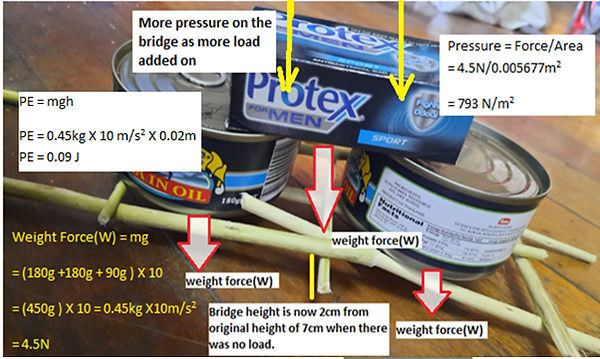
Potential Energy (PE) of the mass or load on the bridge is defined as PE =mgh where m is the mass of the load, g is the acceleration due to gravity and h is the height of the mass above ground level. Since g is a constant, PE is proportional to mass and height. If mass or height increases, PE also increases. However, for PE it will be our special case as more load or mass is added, PE increases and the same time height also decreases.
Pressure is defined as: Pressure(P) = Weight Force(W)/Area(A). Pressure is proportional to weight force or mass and inversely proportional to area. That means if area of contact is kept constant and Weight force increases, Pressure increase. In other words, if mass increases, pressure increases since mass is proportional to weight force.
Step 3: Form a hypothesis or theory
Shown below is the hypothesis for Scientific inquiry, Mathematical proof and Mathematical modelling.
Scientific inquiry
-
As more mass/load is added on the bridge, the weight force, pressure, and potential energy of the load on the bridge will increase
-
As weight force or pressure on the bridge increases, height of bridge above ground level decreases until height is zero or the bridge snap.
Mathematical Proof
-
Proof that weight force(W) is proportional to mass(m).
-
Proof that potential energy (PE) is proportional to mass and height
-
Proof that Pressure is proportional to Weight Force or Pressure is proportional to mass if area is kept constant.
Mathematical Modelling
Predict or estimate the weight force, PE, pressure and height of the bridge as more load added on the bridge

Step 4: Design an experiment to test the hypothesis
To verify the hypothesis for the scientific inquiry will design the experiment by constructing the bridge using the selected or best solution(measurements and materials-sticks).

Bridge
construction
The bridge design is constructed using 8 sticks (5 long sticks – 22cm each & 3 short sticks – 12 cm each) and its maximum height is 7cm when no loaded is added.

TESTING THE BRIDGE WITH LIGHT LOAD
Test the strength of the bridge using different loads before start recording, calculating, and measuring the data collected.
Test the bridge by adding a light load.

TESTINT BRIDGE WITH MORE LIGHT LOAD
Test the bridge by adding another light load on top of the first load

TESTING BRIDGE WITH HEAVIER LOAD
Test the bridge by replacing the two-light load with a heavier load.
MEASUREMENT FOR
SURFACE AREA
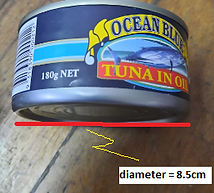
Once confirmed the strength of the bridge, measure the diameter of the load to calculate the surface area of the load on the bridge.


FIRST LOAD MEASUREMENTS & CALCULATIONS
The diagram above shows a load on the bridge with the its weight force, pressure exerted by the load on the bridge and the potential energy of the load above ground level.
second load measurements & calculations
The diagram above shows one more load (two loads) on the bridge with the its weight force, pressure exerted by the loads on the bridge and the potential energy of the loads above ground level.
three load measurements & calculations
The diagram above shows one more load (3 loads) on the bridge with the its weight force, pressure exerted by the loads on the bridge and the potential energy of the loads above ground level.

Step 5: Check to make sure the approach or process is working
Going through the experimental design process it seems to be working well. The desired expectations expected from the experiment to justify or verify my hypothesis was achieved.
Mathematical proof, Mathematical modelling and Scientific inquiry is the same from steps 1 to 5.

Step 6 : Collect and analyse the data to check if it verifies/support or align with the hypothesis.
At this stage for scientific inquiry we continue to collect and analyse the data from the experiment design to check if it verifies the hypothesis. We can apply Mathematical modelling to analyse the data and see if it supports the hypothesis. Even we can apply Mathematical modelling to make predictions or estimations through interpolation and extrapolation based on the data from the experiment design.
But for Mathematical proof, the hypothesis is going to be in a form of formulating a statement/expression or equation and testing the hypothesis by inserting in values to proof if those values satisfies the expression or equation. We do not go further by analysing the data as in scientific inquiry and Mathematical modelling as the pattern works or the inserted values satisfies the expression or equation. Therefore, Mathematical proof combines steps 5 and 6.
In scientific inquiry, results identified from the data analysis in step 6 which can be done through Mathematical modelling must verify the hypothesis formulated in step 3. If the results do not verify or support well the hypothesis then we go back to step 3.
However, if the results verify or support the hypothesis, then we go to the next step which is communicating the results.
-
Scientific inquiry

Weight Force(W) = mg = 180g X 10 = 0.18kg X10m/s2 = 1.8N
Pressure = Force/Area
Diameter = 8.5cm, Radius = 4.25cm = 0.0425m
Area =Πr2 = 22/7 x 0.0425m x 0.0425m =0.005677m2
Pressure = Force/Area = 1.8N/0.005677m2 = 317.08N/ m2
PE = mgh = 0.18kg X 10 m/s2 X 0.05m = 0.09 J

Weight Force(W) = mg = (180g +180g ) X 10 = (360g ) X 10 = 0.36kg X10m/s2 = 3.6N
Pressure = Force/Area = 1.8N/0.005677m2 + 1.8N/0.005677m2 = 634 N/ m2
or
Pressure = Force/Area = 3.6N/0.005677m2 = 634 N/ m2
PE = mgh = 0.36kg X 10 m/s2 X 0.03m = 0.108 J

Weight Force(W) = mg = (180g +180g + 90g ) X 10 = (450g ) X 10 = 0.45kg X10m/s2 = 4.5N
Pressure = Force/Area = 4.5N/0.005677m2 = 793 N/m2
PE = mgh = 0.45kg X 10 m/s2 X 0.02m = 0.09 J
The table below shows the results from observations, recording and calculations as each load is added on the bridge.
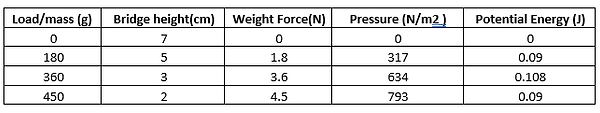

Shown below are the different graphs showing the effects when additional load is added on the bridge. The table above and graphs below also explain/justify or verify the hypothesis for scientific inquiry formulated in Step 3.


2. Mathematical Modelling
We will use Mathematical modelling to prove our hypothesis. The hypothesis is to predict or estimate the weight force, Potential Energy, pressure and height of the bridge as more load is added on the bridge.
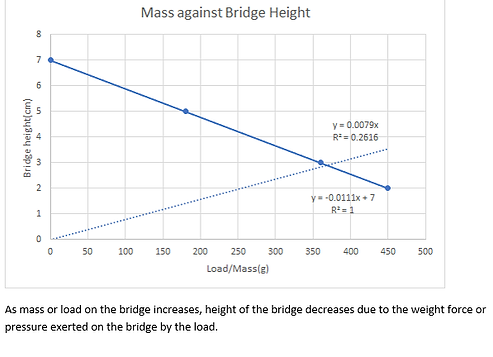
When height of the bridge and weight force is model using the graph below, we can estimate their point of intersection using the graph or by calculating their point of intersection simultaneously.
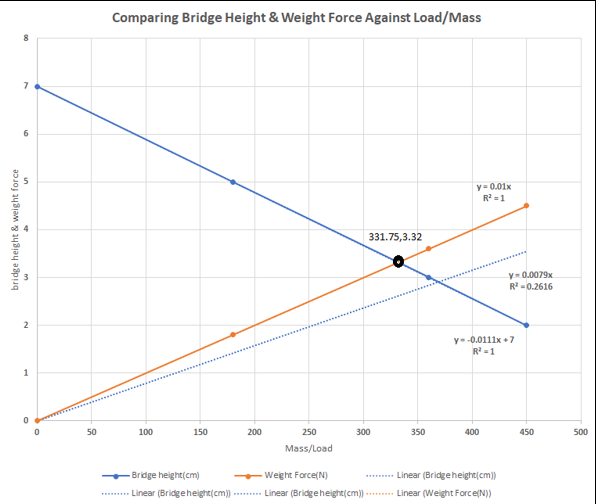
The two straight lines for weight force and bridge height intersects at this coordinate (331.75,3.32).
Solving these two equations simultaneously we can find the point of intersection.
y= 0.01x -------- 1
y = - 0.0111x + 7------------2
Sub equation 1 into 2
y = - 0.0111x + 7
0.01x = - 0.0111x + 7
0.0211x = 7
X = 331.75 ---------3
Sub 3 into 1 or 2
Sub equation 3 into equation 1
y= 0.01x
y= 0.01 X 331.75
y = 3.32
Therefore, x = 331.75 and y = 3.32. However, we can estimate the point of intersection from the graph. When the load is 331.75 g, the height of the bridge will be 3.32cm.
As the load/mass on the bridge increases, the weight force increases as well but the height of the bridge decreases due to the weight force or pressure exerted on it.
Part of the table below shows our predicted values as we model the relationship between the quantities.
What will happen if I add two additional soap of mass 90g each to the current load on the bridge as shown below?

Two additional soap of mass 90g each added one at a time to the current load (450g) on the bridge
The results are shown in the table below if those two additional soap of mass 90g each added one at a time to the current load on the bridge which is 450g
The predicted values are based on the assumption of adding a 90 g soap to the existing load each time.


3. Mathematical Proof
Will apply Mathematical proof to verify the following hypothesis.
-
Proof that weight force(W) is proportional to mass(m).
If W = mg, then
W = m since g is a constant.
Either W is proportional to m. That means if mass(m) increases, weight force (W) also increases.
-
Proof that potential energy (PE) is proportional to mass and height
If PE = mgh, then
PE = mh since g is a constant.
Either PE is proportional to m and h. That means if mass(m) and height (h) increases, potential energy (PE) also increases.
-
Proof that Pressure is proportional to Weight Force or Pressure is proportional to mass if area is kept constant.
If P = W/A, then
P = W if A is kept constant.
Either P is proportional to W and inversely proportional to A. That means if Weight force(W) increases when Area (A) is kept constant, Pressure (P) also increases. However, pressure (P) is inversely proportional to Area(A). Which means as Area(A) decreases, Pressure(P) increases.

Step 7 : Communicating the results.
For Mathematical proof, we communicate the results that the expression or equation is true if it connects a sequence of numbers as in step 6, otherwise we go back to making a hypothesis which the hypothesis formulated is based on rules, laws and sequence. This involves constructing the proof by analysing the data and communicating the proof that it is valid. If it is not, then we go back to step 3 and fix the proof.
For Mathematical modelling and scientific inquiry, we communicate the results from our analysis that satisfies the hypothesis.
